Really tough second quarter
As expected, the tanker market remained weak during the second quarter of 2018. The reasons are well known but are worth repeating: The combination of OPEC’s reduced production and stock withdrawals in the consuming countries has resulted in a reduced transport demand for both crude oil and product tankers. In addition, there have been extensive ship deliveries and overall this has resulted in low freight rates – for us and the rest of the sector.
The goals of the production cuts were to get oil prices up and to force a reduction in the record-high global oil stocks. Both goals have now been achieved. Oil prices have increased by over 50 percent compared with a year ago, while oil stocks have gradually declined and at the time of writing are back below an average five-year level.
Increased production
With the recent return to more normal stock levels, both OPEC and Russia have decided to increase production – and, ultimately, exports. This will bring a rise in demand for tank tonnage in the period ahead. In parallel, we expect that current high scrap prices and investments necessitated by new legal requirements will result in a continued phasing-out of older vessels. So far in 2018 (as of July), a total of 113 vessels have gone for recycling – compared with 78 in the full year 2017. If this rate persists, we may see almost zero growth rate in certain segments this year.
A progressively stronger market
The tanker market is both cyclical and volatile in nature. From a historical perspective, we can see that high peaks are followed by deep troughs and vice versa – and the fluctuations often come fast. This presents both opportunities and challenges. It is important to have a strategy that enables us to quickly adapt based on each given situation. To grasp the opportunities and deal with the troughs, we are working actively with our fleet. When times are good, it is about optimising opportunities, when they are harder, it is about ensuring employment – and creating the right starting position for when the market turnaround comes.
And this is where we are now. The combination of increased demand for tanker transport and moderate fleet growth means that we maintain our belief in a progressively stronger market at the end of the year. We also position our fleet on the basis of this scenario. The majority of our vessels are on the open spot market and are fully ready to start transporting freight when the turnaround comes.
Strengthened positions
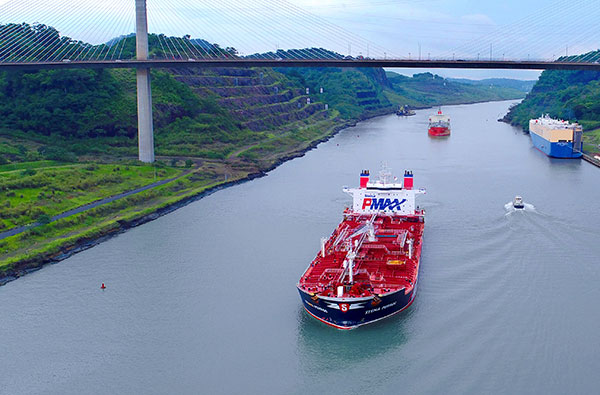
During the quarter, we decided to participate in charters of three suezmax vessels with Stena Bulk. Another suezmax vessel was chartered in after the end of the quarter. By chartering in the tankers, we strengthen our presence in the crude oil tanker segment and continue to increase our earning capacity. We have now brought in a total of ten vessels on short-term charters (50% share) during the last year – six MR (ECO) and four suezmax tankers. This means we are continuing to take advantage of the favourable chartering opportunities that arise in weak markets. During the quarter, we also secured employment for the P-MAX tanker Stena Paris for a further year. To be given a renewal of confidence for the sixth consecutive year by one of the world’s largest oil companies is obviously really pleasing.
So, to reiterate what we previously said – the market is still weak but the fundamentals continue to point to an impending upturn.